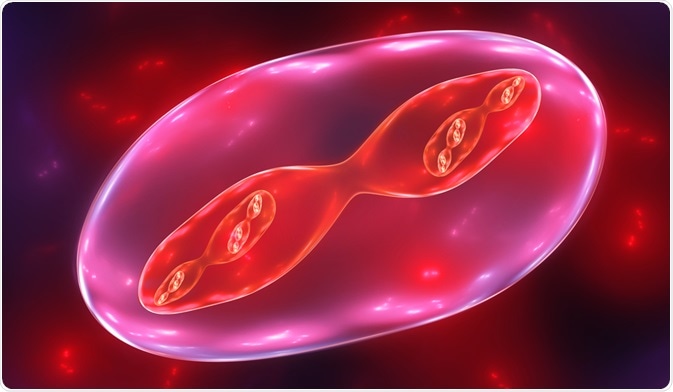
Over the last four decades, flow cytometry has been improving to allow better analysis of the cell cycle under different physiological conditions. Flow cytometry focuses on different DNA targets in order to track cell cycle progression.
 Image Credit: Jurik Peter / Shutterstock
The cell cycle
Cell division occurs through a series of checks and balances known as the cell cycle. This cycle has four main stages, called gap 1 (G1), synthesis (S), gap 2 (G2), and mitotic (M) phases.
The different stages of the cell cycle all have distinctive roles. In G1, the cell is preparing to synthesize DNA. The DNA synthesis occurs during S phase, which leads to cells containing an elevated level of DNA. After this, the cell prepares for and enters mitosis, during which the cell separates into two daughter cells.
Progression through the cell cycle is managed by cyclin-dependent kinases (CDKs) and cyclin complexes. CDKs are protein kinases that become active at certain parts in the cell cycle. Without CDK activation, mitosis is prevented. Regulation of the cell cycle is largely done by the phosphorylation of CDKs and cyclins.
Mitosis
Flow cytometry
Cell cycle analysis is among the most commonly applied uses of flow cytometry. As a result of this, several types of techniques have been developed. All of these techniques focus on quantifying intracellular components, most commonly DNA, as well as cell cycle-related metabolic molecules, such as CDKs and cyclins.
Some measures are univariate, which means they focus on measuring DNA content only. This is prefaced by preparing the cells with a fluorescent dye, which is added to permeabilized single cells or nuclei. A commonly used dye that targets nucleic acid is propidium iodide (PI).
This dye will bind DNA, and during flow cytometry, the DNA will emit a fluorescent signal. The total fluorescence emitted from the cell will, therefore, vary depending on how much DNA is present. Because of this, G2 and M phases often cannot be distinguished from one another, because they share similar DNA content.
Flow cytometry can sometimes misidentify cellular DNA content of two cells as that of one cell. This is called finding doublets, in which two cells with DNA content typical of cells in G1 are mistaken as one single cell with DNA content typical of G2/M phase. To correct for this, flow cytometers can be equipped with a so-called Doublet Discrimination Module.
The Doublet Discrimination Module can pick out single cells based on the pulse-processed data. The pulse-processed data is generated from the emitted fluorescence of the DNA dyes, which in addition to the intensity measurement can show the pulse-area and pulse-width of the samples. Plotting the width against the area allows the module to tell G1 doublets apart from G2/M singles.
Analysis of cyclins and CDKs in the cell cycle by flow cytometry is more multifaceted than DNA, since different cyclins become active at different parts. For example, cyclins A and B show high expression during S phase. CDKI p16 shows high expression during G1 phase, whereas CDKI p21 did not. This expression pattern can change during disease states, such as cancer.
Time-lapse (snapshot) measurements
Measurements can be done as one-off snapshot cell measurements or time-lapse measurements. A single time-point measurement can show the percentage of cells in G1, S and G2/M phases.
Time-lapse measurements can show populations of cells in the cell cycle in a synchronized manner or halted cell cycle progression at specific points in the cell cycle. Unlike single time-point measurements, these show the kinetics of cell progression through the cell cycle.
In addition to DNA, other measures may need to be used. Distinguishing cells that are in the process of synthesizing DNA can be done using bivariate techniques, meaning both DNA and another marker of cell cycle progression are used.
Some methods make use of an analog to thymidine called 5’-bromo-2’-deoxyuridine (BrdU). BrdU is commonly applied to measure cell proliferation in living tissues, which means it can be used as a snapshot measurement or as a time-lapse measurement.
Time-lapse measurements have the advantage of being able to indicate the rate of progression through the cell cycle to pinpoint which stage cells are in. In flow cytometry, BrdU can be detected using DNA dyes or with fluorescent BrdU antibodies, which show the incorporation of BrdU into cellular DNA.
Further Reading